by _strange_ » Wed Sep 13, 2023 3:59 am
Hi Eric,
I dont know what this is called but I cant help seeing it now. Clearly there are horizontal lines on the chart as you noted in the lectures. Ive spent many many hours now reviewing charts for this aspect of price action.
This retracement, testing, rejection of areas on the chart is hands down the biggest revelation Ive had. You can really spin off on this too, you can take a real small macro level look at every single little swing and test, and blow it up and lay it out over the last week, last month, the daily chart, its happening on every level and seems to be one of, if not the most significant aspect of price action. Honestly seems like the core of price action itself, more so than even trendlines. It seems like this would come first, then trendlines laid over it for confluence.
In fact, its actually quite difficult to stay focused on 1 thing now (LOL), because I think I understand how people are trading Range charts or Renko charts and whatnot.
Anyway, Ive attached yesterdays chart laid out with the EMA removed and with some trades marked playing the price points I noticed yesterday.
What im curious about is - this seems like a perfectly reasonable trading strategy by itself. To be clear, I dont have any intention or desire to re-think the wheel or change the strategy, but in an effort to confirm what I am seeing and to understand everything as deeply as possible, am I seeing this correctly?
Would it be reasonable to think that trading like this would be possible, but with much less probability than if there were second entries on most of these areas? Meaning, trading like this would be maybe a 60% probability trades, while if there were good second entries in most of these areas it would bring the probabilities much higher, say, 90%? This is hypothetical obviously, im just trying to put a number on it for the sake of discussion.
In other words, the second entries are basically traps, and that trap is what increases our odds and gives us the final confirmation and lets us know that the opposing side is "done"? The better the "trap" in these areas, the better and more powerful the trade?
Side question: is the stuff im seeing in the attached image one of the reasons why you trade a naked chart without all the markups and stuff like Mack?
Side question #2: What exactly is the horizontal level aspect called? Is orderflow the proper terminology?
Thanks again Eric and apologies if this post is all over the place

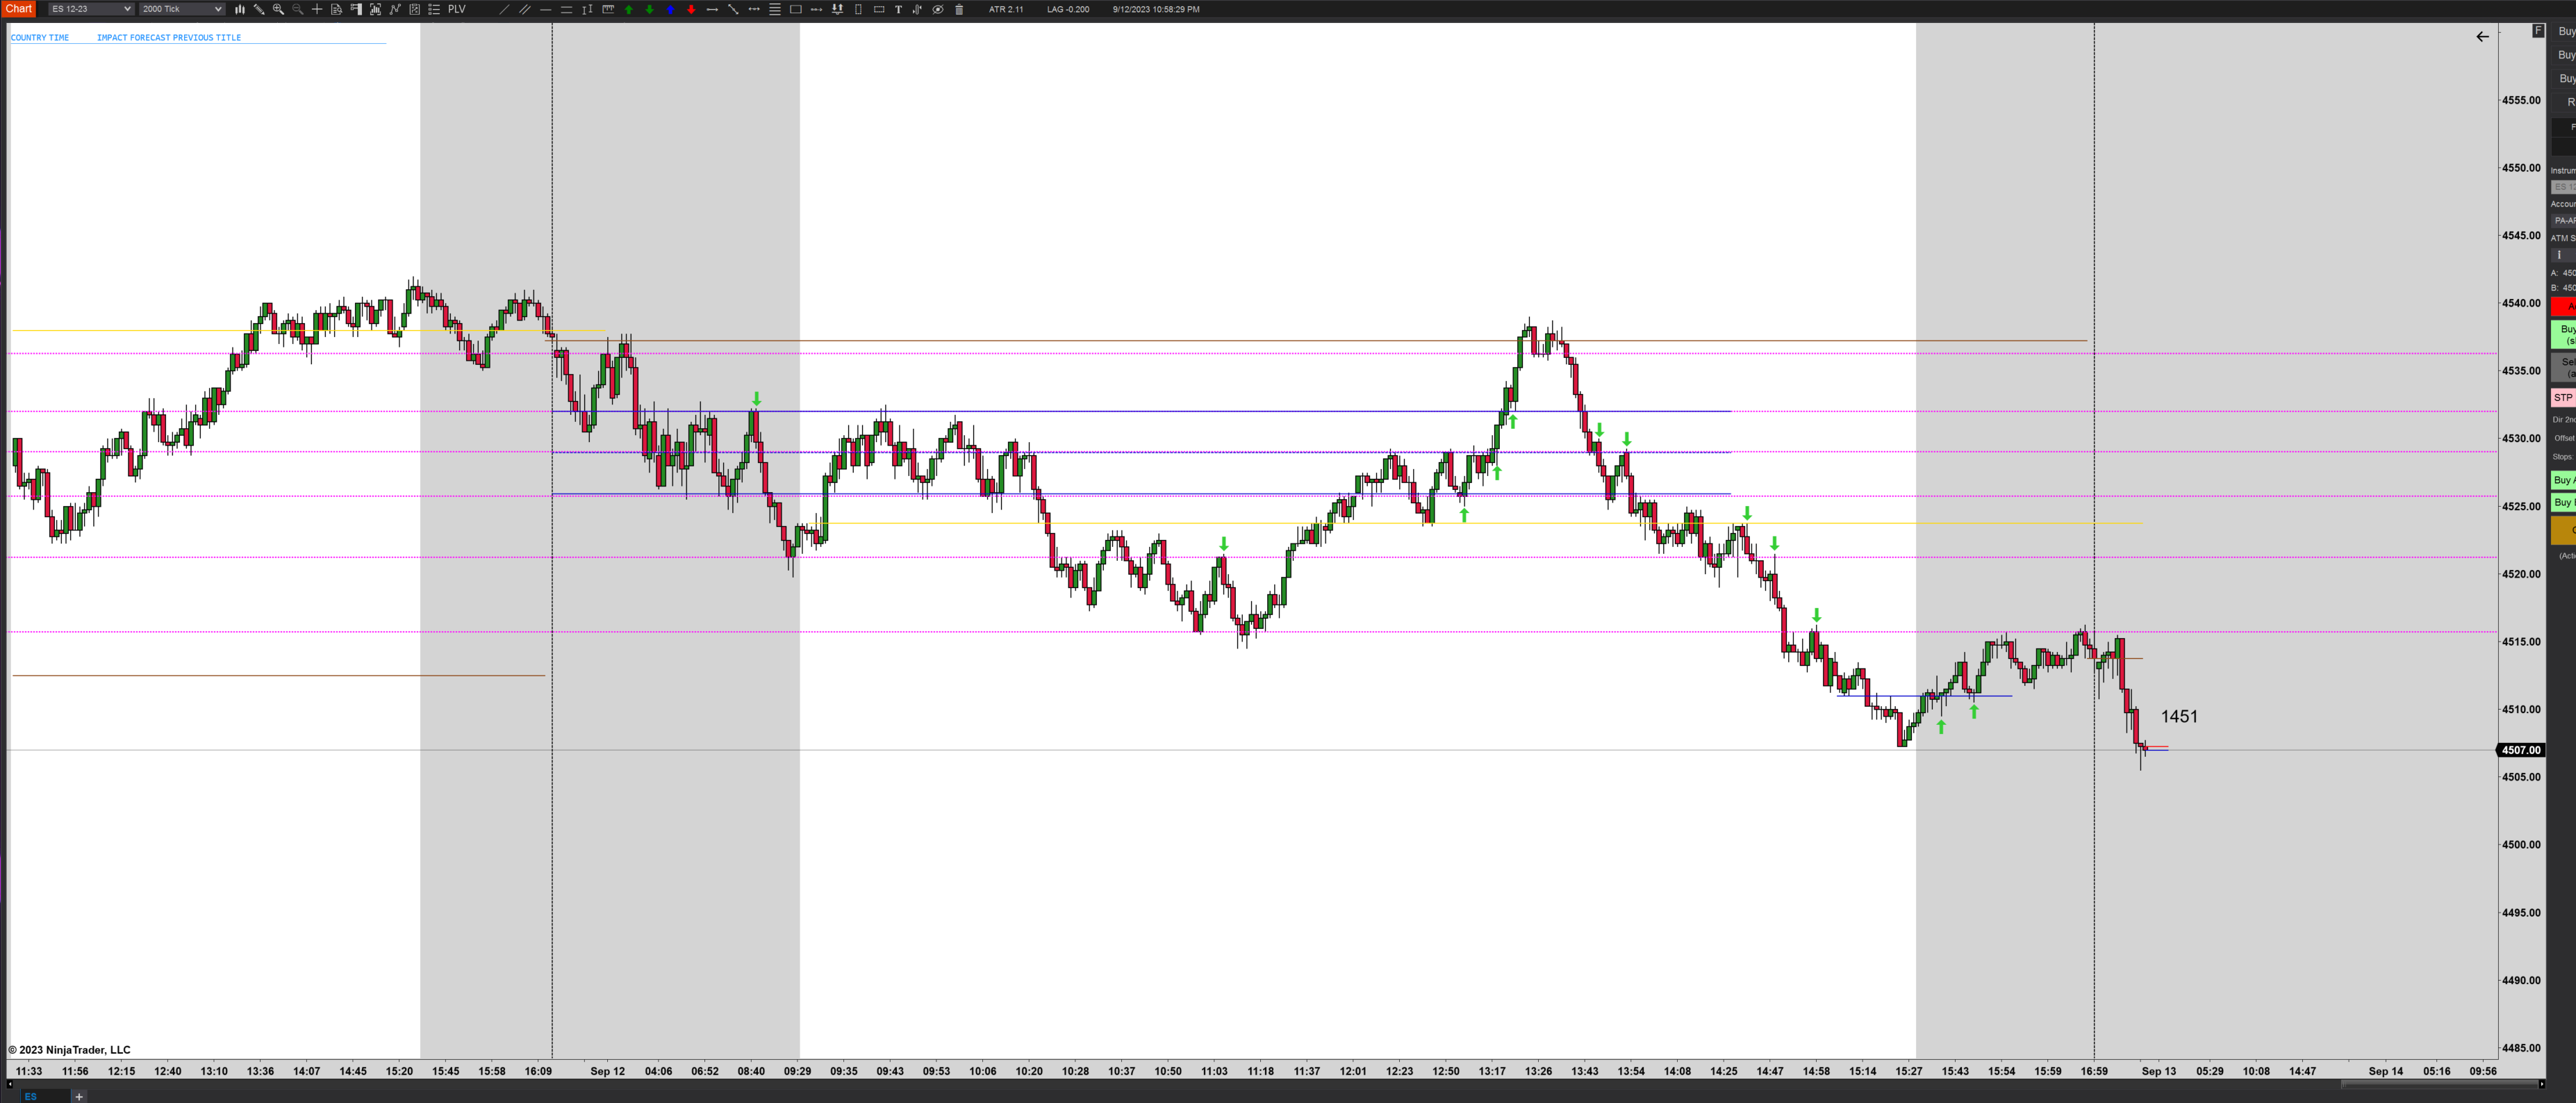
- Screenshot 2023-09-12 225842.png (317.56 KiB) Viewed 5282 times
Hi Eric,
I dont know what this is called but I cant help seeing it now. Clearly there are horizontal lines on the chart as you noted in the lectures. Ive spent many many hours now reviewing charts for this aspect of price action.
This retracement, testing, rejection of areas on the chart is hands down the biggest revelation Ive had. You can really spin off on this too, you can take a real small macro level look at every single little swing and test, and blow it up and lay it out over the last week, last month, the daily chart, its happening on every level and seems to be one of, if not the most significant aspect of price action. Honestly seems like the core of price action itself, more so than even trendlines. It seems like this would come first, then trendlines laid over it for confluence.
In fact, its actually quite difficult to stay focused on 1 thing now (LOL), because I think I understand how people are trading Range charts or Renko charts and whatnot.
Anyway, Ive attached yesterdays chart laid out with the EMA removed and with some trades marked playing the price points I noticed yesterday.
What im curious about is - this seems like a perfectly reasonable trading strategy by itself. To be clear, I dont have any intention or desire to re-think the wheel or change the strategy, but in an effort to confirm what I am seeing and to understand everything as deeply as possible, am I seeing this correctly?
Would it be reasonable to think that trading like this would be possible, but with much less probability than if there were second entries on most of these areas? Meaning, trading like this would be maybe a 60% probability trades, while if there were good second entries in most of these areas it would bring the probabilities much higher, say, 90%? This is hypothetical obviously, im just trying to put a number on it for the sake of discussion.
In other words, the second entries are basically traps, and that trap is what increases our odds and gives us the final confirmation and lets us know that the opposing side is "done"? The better the "trap" in these areas, the better and more powerful the trade?
Side question: is the stuff im seeing in the attached image one of the reasons why you trade a naked chart without all the markups and stuff like Mack?
Side question #2: What exactly is the horizontal level aspect called? Is orderflow the proper terminology?
Thanks again Eric and apologies if this post is all over the place :lol:
[attachment=0]Screenshot 2023-09-12 225842.png[/attachment]