Hello, I'm currently working through lesson 4.3 supply and demand and most of it is making perfect sense and I'm learning a lot!
I do have a couple questions though.
1. During the lesson you go over a few charts marking some of the key horizontal areas. For the supply and demand zones, are there more on the chart than what are marked?
I just want to make sure I'm understanding it correctly. I've attached a chart with numbers marked for different areas.
2. Would numbers 1-4 also be supply and demand areas?
3. For #5 there's a huge doji bar right after the marked supply area. Would that be considered a test of the supply area and if so
does that mean that area is no longer imbalanced, or less so?
Thank you!
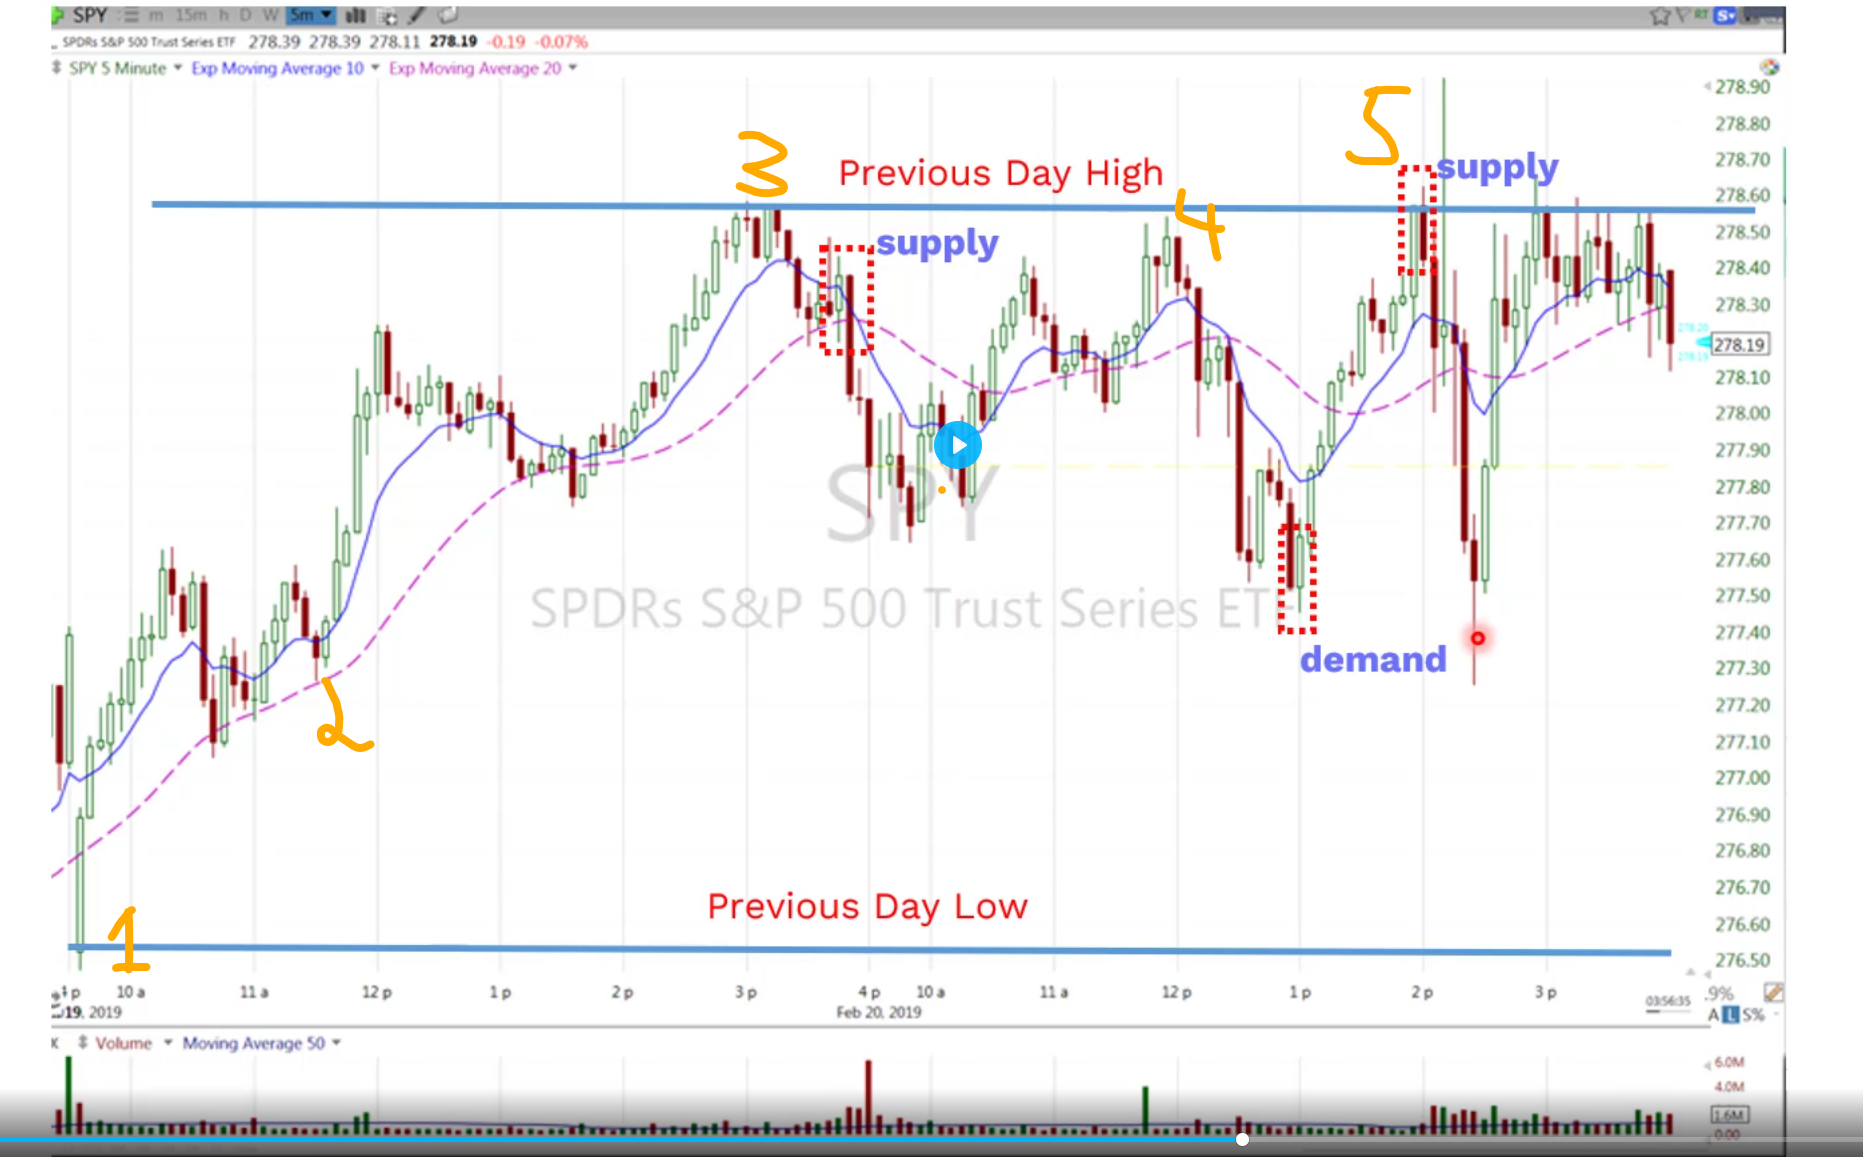
- supply_and_demand.png (910.06 KiB) Viewed 2836 times
Hello, I'm currently working through lesson 4.3 supply and demand and most of it is making perfect sense and I'm learning a lot!
I do have a couple questions though.
1. During the lesson you go over a few charts marking some of the key horizontal areas. For the supply and demand zones, are there more on the chart than what are marked?
I just want to make sure I'm understanding it correctly. I've attached a chart with numbers marked for different areas.
2. Would numbers 1-4 also be supply and demand areas?
3. For #5 there's a huge doji bar right after the marked supply area. Would that be considered a test of the supply area and if so
does that mean that area is no longer imbalanced, or less so?
Thank you!
[attachment=0]supply_and_demand.png[/attachment]